Selling to customers today is about building and maintaining relationships. Relationships are built by knowing your customers, what is important to them, and responding to them with the right communication at the right time. Dynamics 365 Sales Insights enables salespeople to build stronger relationships with their customers and prospects, take actions based on insights, and close more deals faster.
Through the power of artificial intelligence powered by Microsoft’s Azure platform, Sales Insights analyzes customer interaction data and sentiment in order to help salespeople better understand their business relationships and choose the best path forward.
There are many components of Dynamics 365 Sales Insights that help salespeople to engage in more meaningful and personal interactions. Visit our blog to see our top ten Sales Insights features.
The features that will be discussed in this article are available with the Dynamics 365 Sales Insight Add on to Sales Enterprise OR with a Dynamics 365 Sales Premium license. Due to a recent announcement by Microsoft, some of these features are available with a Sales Enterprise license.
Conversation Intelligence
Customer conversations are a critical part of the sales cycle. With Conversation Intelligence, sales organizations can find common patterns and derive meaningful insights.
Conversation Intelligence provides meaningful insights by automatically analyzing your sales team’s phone calls – looking not only at the content, but the sentiment and behavior style as well. Keywords can be defined and highlighted to ensure your sales team has a unified message. Based on customer phone calls, salespeople can easily follow up on important business issues and quickly transform their engagements into revenue. Salespeople can effectively guide buyers toward a purchase using certain conversation techniques.
Managers can proactively coach sellers and develop more personalized sales training by understanding seller behaviors and what works well for top performers.
Relationship Intelligence
Relationship Analytics in Dynamics 365 examines your relationships with your customers. It surfaces important KPIs including how often you engage with your customers, how your customers engage with you, and how often and how quickly you and your customers respond to each other. Relationships Analytics also explores volumes of communications, i.e. number of emails, appointments, phone calls, and other activities.
Surfacing this data provides sales organizations with an activity history overview, relationship KPIs, and a health score. Businesses can easily see health trends for their contacts opportunities, leads, and account records.
Sales staff and managers are better equipped to answer questions such as if they have a good relationship with a customer, how much time they have spent with a customer, and what the customer’s response rate is. From there, organizations can decide what adjustments they might need to make. Salespeople also can easily see which opportunities they should invest the most time on.
The Relationship Pipeline
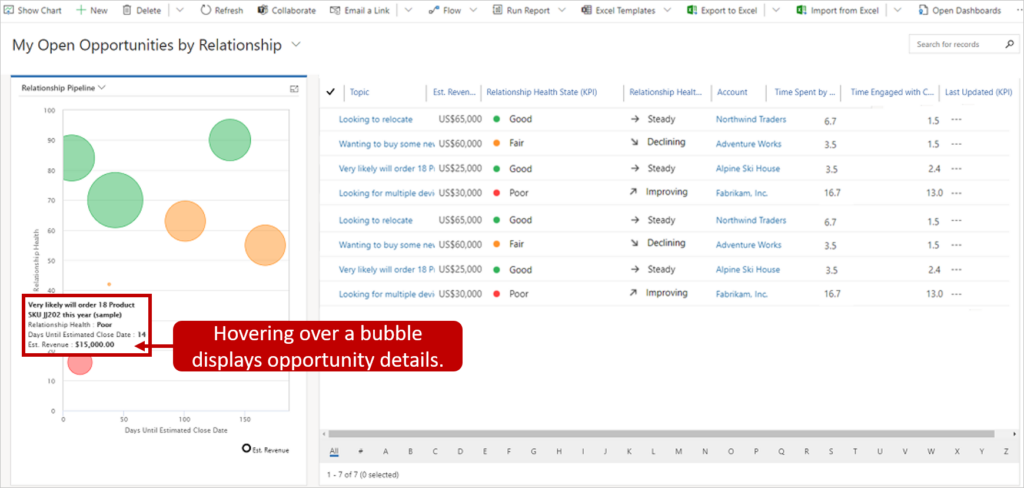
While working on opportunities it can be helpful to get a quick overview of the relationship health of their opportunities. The relationship pipeline view consists of a bubble chart that gives salespeople an overview of the relationship health of their opportunities. At a quick glance, salespeople can see the health, close date, and estimated revenue for their opportunities. The relationship pipeline view can be accessed from the opportunity table view list.
Each upcoming opportunity is plotted as a bubble on the relationship pipeline chart. The size of the bubble indicates the estimated revenue of the opportunity. Relationship health is plotted on the y-axis. The higher up the bubble is on the chart, the higher its health. Estimated close date is plotted on the x-axis. Therefore opportunities on the left of the chart might expire soon.
The most critical opportunities are those with the largest bubbles located near the bottom left corner, whereas the most promising opportunities are those located near the top of the chart.

The color of each bubble indicates relationship health of the opportunity:
- Green indicates a good relationship.
- Yellow indicates that the relationship is fair.
- Red indicates a poor relationship.
- Gray indicates that the results have not been calculated or that there isn’t enough data.
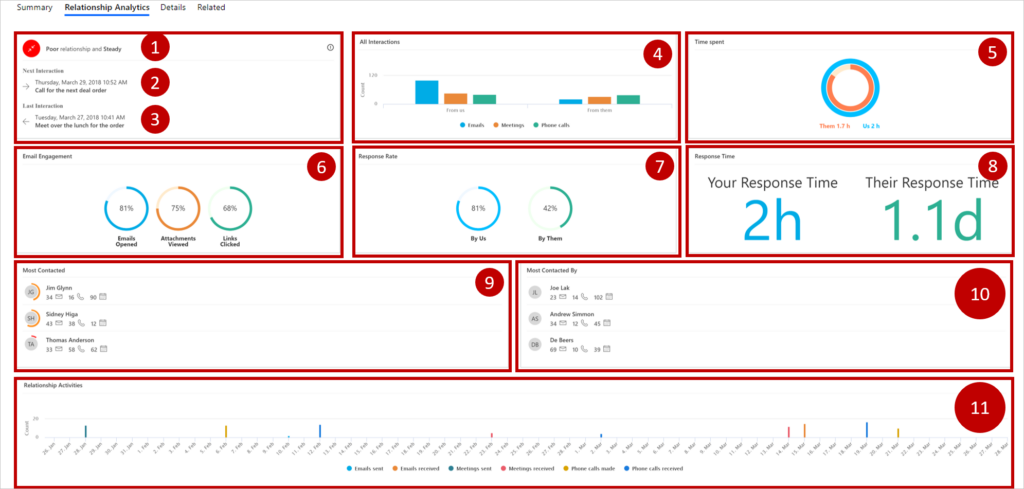
When viewing customer and opportunity records, salespeople can see complete analytics including graphs, KPIs, email interaction history, full activity history, and relationship health.

Included in this view:
- Email engagement
- Time spent
- Response time and rate
- Most contacted/ most contacted by
- Relationship activities
- Next, last, and all interactions
- Relationship health and trend


